.svg)

Figuring out if a college is in good financial health can tricky. Here are some techniques you can use:
The easiest way to figure out a college's financial health is by knowing its bond rating, which is essentially its credit score. Two main agencies rate colleges: Moody's and S&P/Fitch (they use the same system) but sadly access to this information is aimed at institutions not interested parents, so it's not that accessible. That said, googling ‘university-name bond rating' often brings up a result, particularly if they've been downgraded.
Anything rated A or higher suggests financial stability. If a college is rated BBB or below, dig deeper into why.
Red flag: A college with a downward rating trend (like dropping from A to BBB over 2-3 years) or anything below Ba/BB.
You’ll have to wade through a lot of links to financial aid but if there’s been troubling news, it may surface.
Go to the Common Data Set (CDS) for the past 5 years, if available, and track:
(To find the CDS, it's easies to google 'college name' + CDS rather than try to navigate the college's website to find it.) There are only a handful of colleges that can survive many years of declining enrollment because they have large endowments, and those colleges aren’t typically the ones with this problem.
The ‘discount rate’ is the rate that the college is discounting its listed tuition. You can probably get a sense of a college’s financial health without doing this calculation, but here's how you do it.
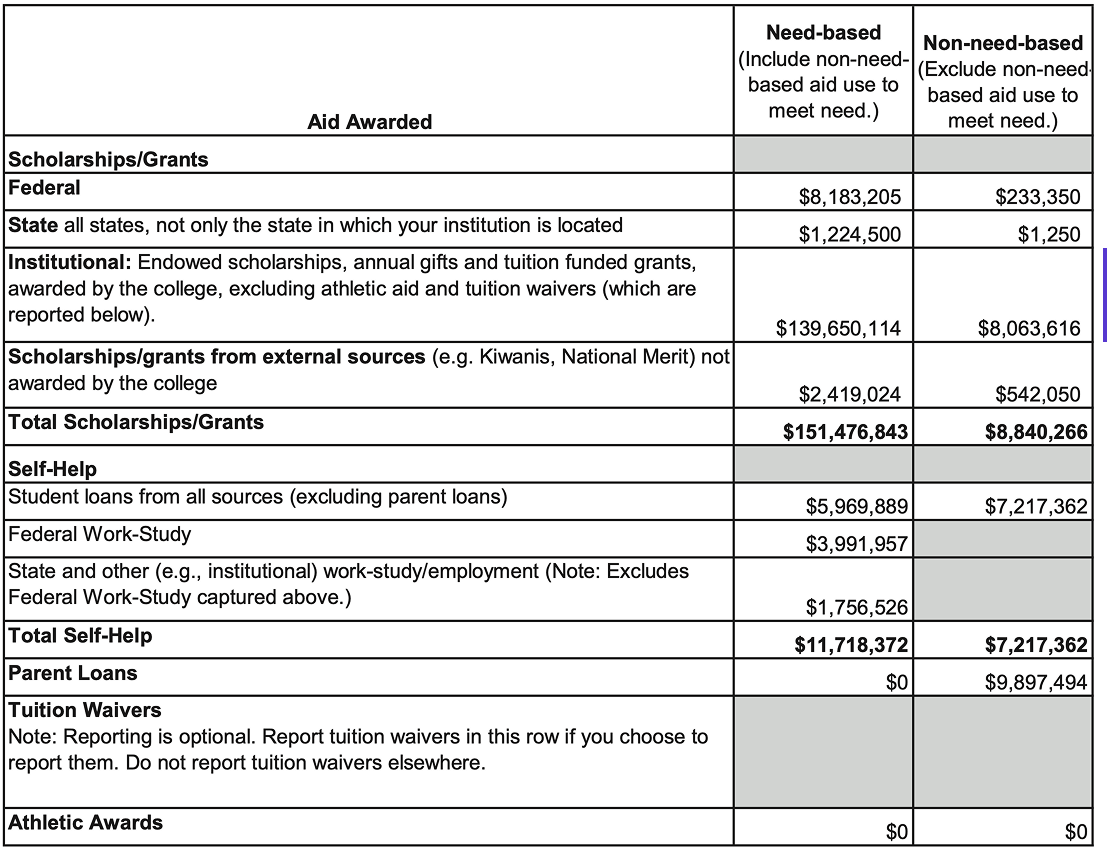
Download your college’s latest CDS (as above). First go to Section H1, Aid awarded to enrolled undergraduates. Now let’s go to H1, Number of Enrolled Students Awarded Aid:
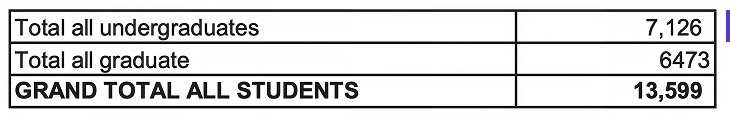
Now go to B1, Institutional enrollment and look for total undergraduate enrollment (7,126):
Undergraduate institutional aid ÷ undergraduate population = Average aid per student. In this case $147,713,730 ÷ 7,126 = $20,731. Now, perform this calculation: Average aid amount ÷ Tuition = Discount rate. In this case, $20,731 ÷ $71,982 = 29%. Do this for 3-5 years of CDS data to see what trend emerges. A discount rate snapshot matters less than its trajectory over 3-5 years. An upward trajectory plus declining enrollment is a red flag, particularly if the rate is already on the high side.
Try throwing the college's CDS into an AI with this prompt:
I’m interested in calculating this college’s discount rate. In order to do that, perform these calculations: Undergraduate institutional aid ÷ undergraduate population = Average aid per student. Then, Average aid amount ÷ Tuition = Discount rate
You can find the information in these sections: