.svg)
What are your go-to resources for college research? Typically, families use rankings sites, BigFuture, guidebooks and the colleges’ own websites. These are all decent—often great—sources, but with the exception of a college’s own website, the information isn’t always up-to-date, can lack detail and even sometimes be based on incorrect data.
The Common Data Set is what I like to think of as the ultimate source of truth stripped of any marketing.
It’s a standardized format that colleges use to report detailed information about their student body, admissions process, finances, and academic programs. Think of it as a sort of annual report to the education world with detailed statistics presented in a more or less consistent format across colleges.
To find it, it's usually easier to Google "College-name CDS" than it is to wade through the college’s website. I’ll download the most recent year, but if you like to nerd out on data, you can grab 2-3 previous years too and trends over time can be revealing. It’s usually a PDF, sometimes an Excel spreadsheet and (rarely) is just presented directly on the website.
I wouldn’t try to read the entire document—it's 40+ pages of tables. Instead, I’ll focus below on the sections that are most worth your time. Sections I don’t cover below, e.g., ‘G: Annual Expenses’ are better researched elsewhere. You can follow along with the Common Data Set from the '24-'25 year at Tufts and Case Western Reserve.
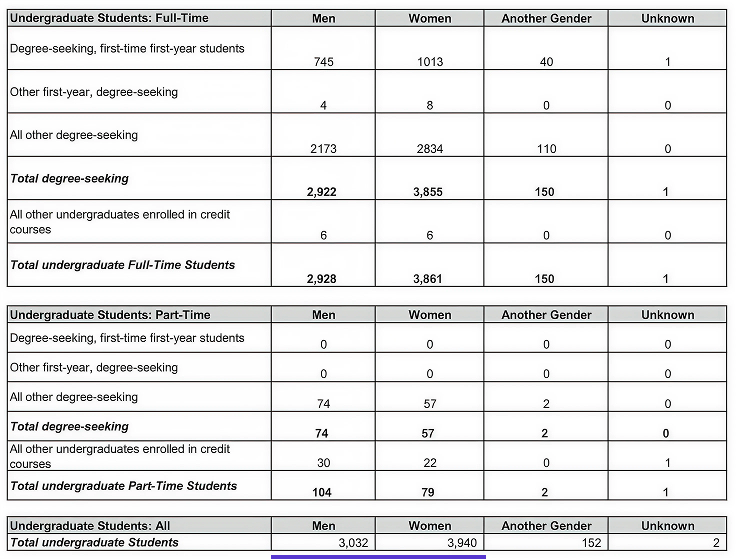
This section gives you a high level view into the school environment.
What I pay attention to:
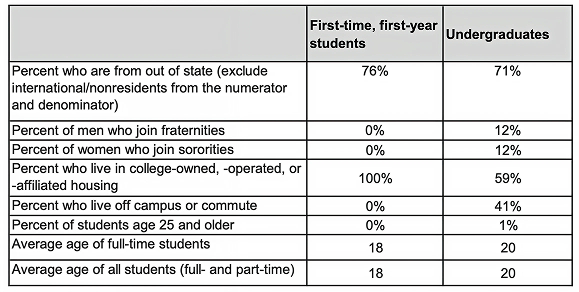
Most of the data is presented in raw numbers which I find less helpful, so I’ll often grab a screenshot, throw it into an AI and prompt it to convert things into percentages, which I find to be a more valuable metric.
Some institutions can be surprisingly skewed in terms of gender. Non-engineering schools often skew female, particularly state schools, whereas as engineering schools can skew heavily male.
This is the key section for all things admissions and where you can go to understand what the college values most. Some areas to investigate:
What colleges rate as important could help shape your list, at least on the edges. Is demonstrated interest ‘very important’? Then definitely make sure to demonstrate it! They're telling you that they want to see that you want them.
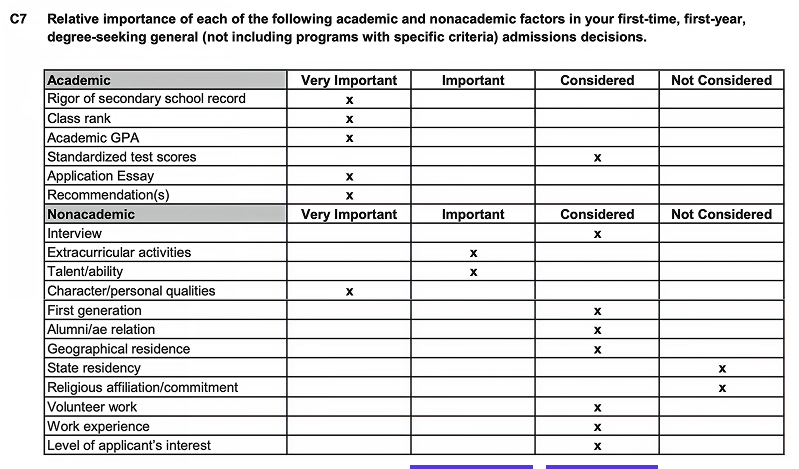
If you have stellar test scores but only so-so extracurriculars, that might impact your list. I wouldn't suggest using this to overdetermine what gets on there, but if you're debating between a couple schools and they seem equally appealing, this might be a place to look.
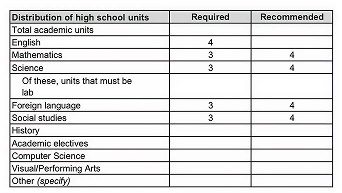
A note about coursework: colleges often want more than your high school requires, so it helps to understand this early. They typically want students to use high school to get a broad education across core subject areas. Families are often caught unawares by the foreign language requirement, with highly selective colleges recommending four years of a single language. The University of California requires a year of visual or performing arts, another requirement that can surprise families.
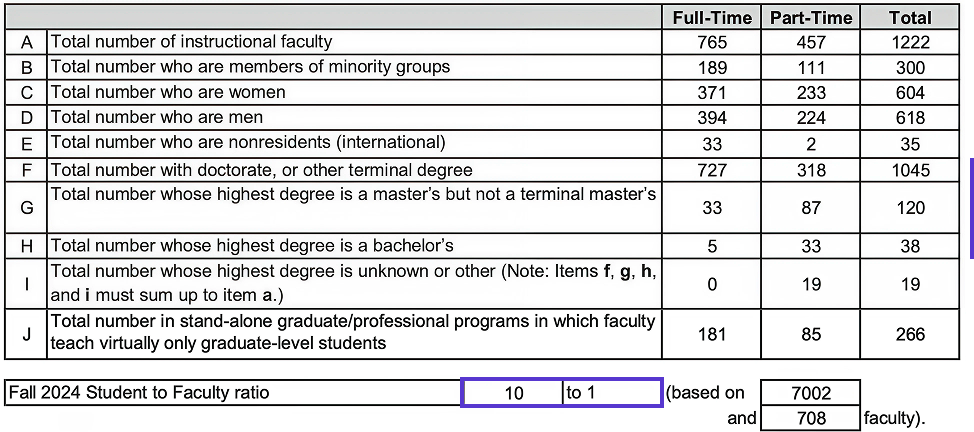
This section is all about campus culture:
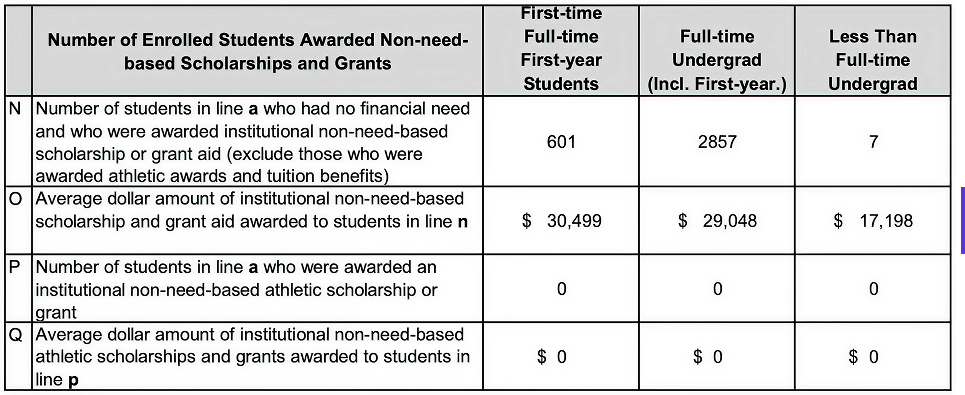
This section reveals a college’s enrollment strategy. Your goal should be to find a school whose enrollment strategy maps well to your financial circumstances. Look out for:
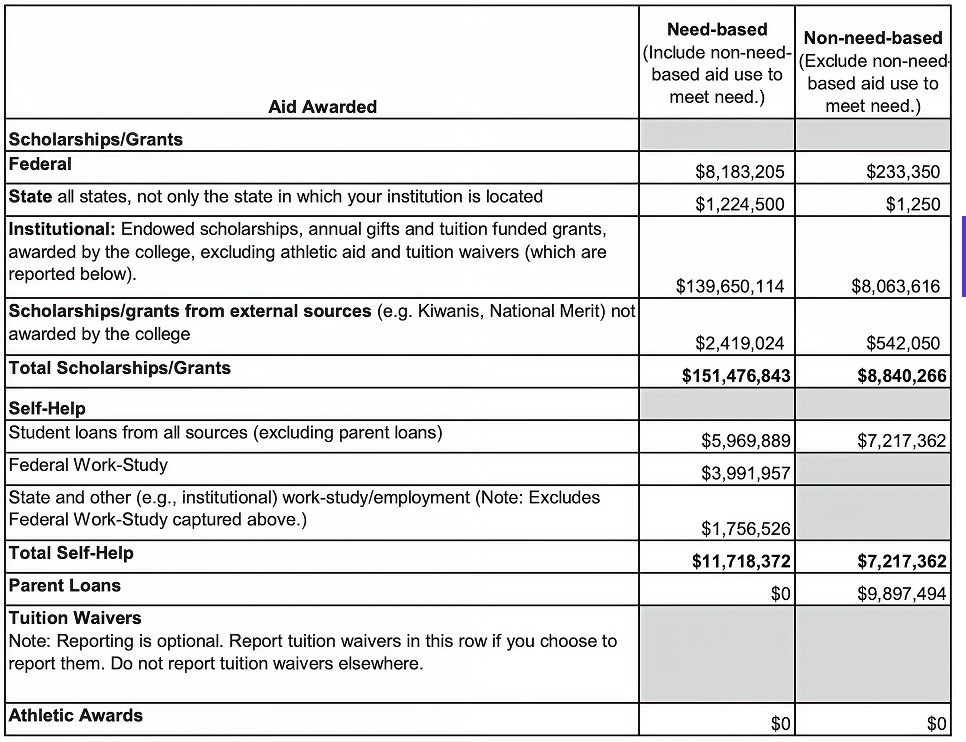
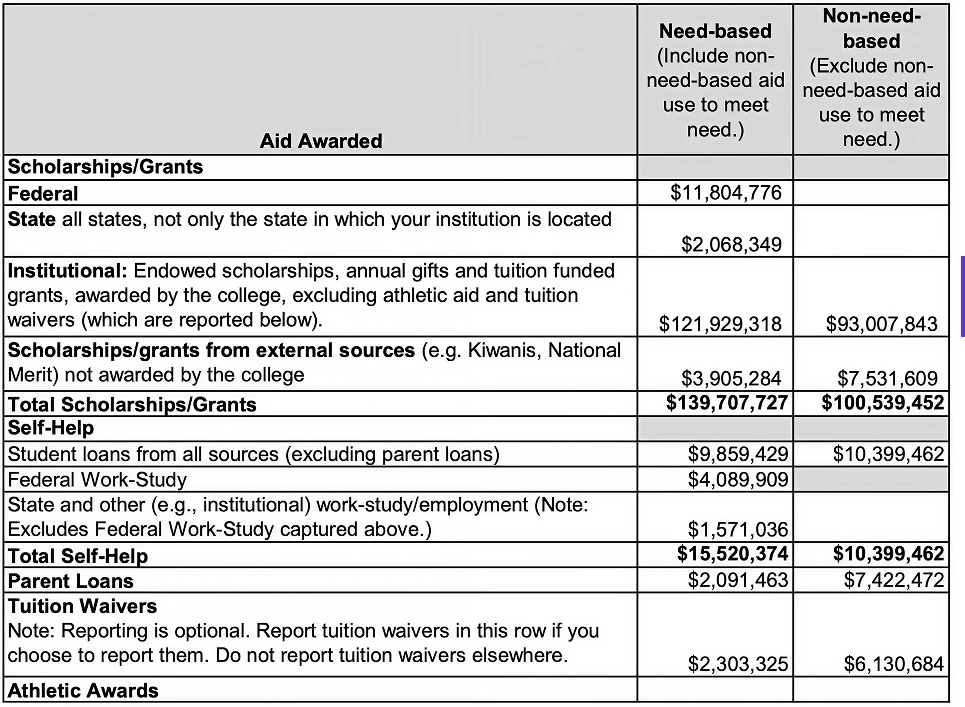
In the above examples, you can see that Case Western offers quite a bit of merit-aid, whereas Tufts offers very little and so for families looking to avoid full-pay but who aren't going to qualify for much or any need-based aid, Case Western would make a lot more sense.
A school showing 95% of students receive aid but average awards under $15,000, for example, is very different from one showing 60% receive aid averaging $35,000 and by researching here, you can have a decent idea of what amount of merit aid to expect.
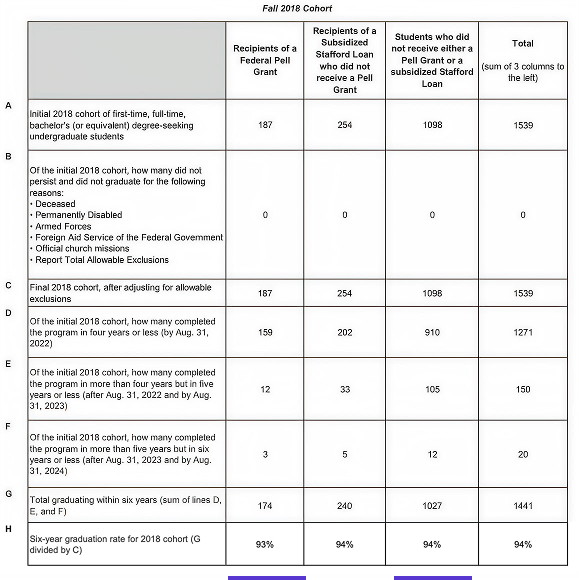
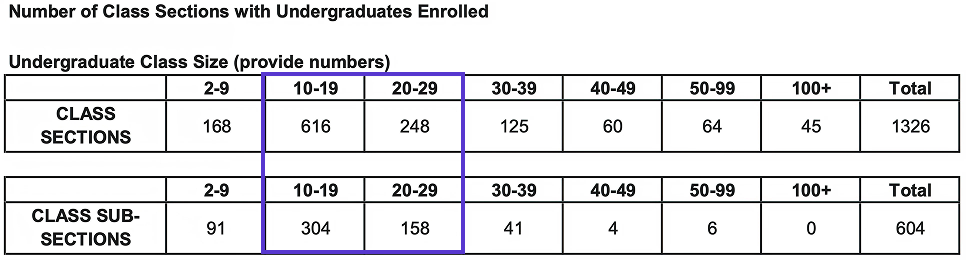
This section covers some aspects of the academic experience. Some things to note:
These factors have been removed or were never included in many of the rankings sites, so if these factors are important to you, I suggest looking up this section of the CDS as these numbers can vary widely and schools with not-so-great numbers don't make a point of publicizing them.
This section breaks down majors by percent of the student population though it’s often fairly high level, e.g., ‘social sciences’ so may require further investigation. Look out for:
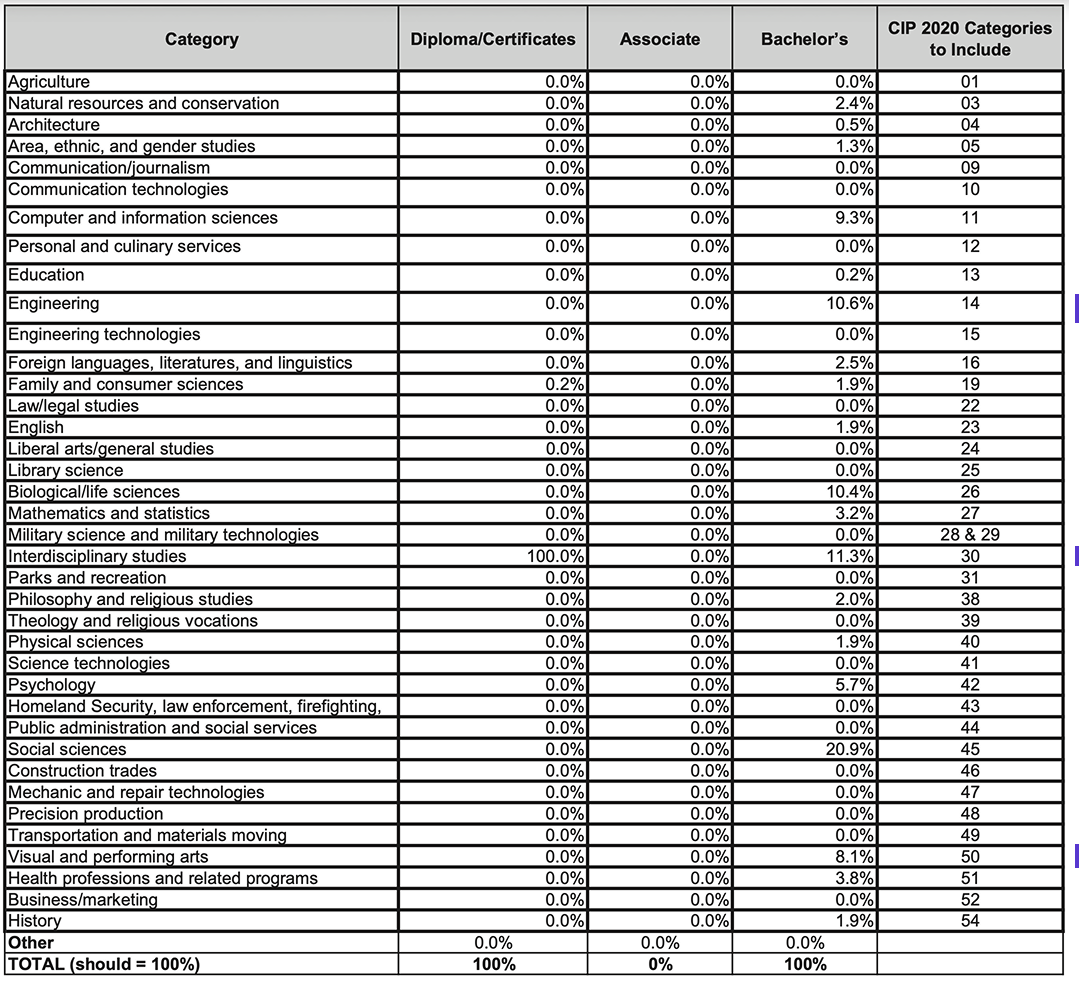
So what can you be on the lookout for, either to reassure or to cause concern?
By understanding how to read the CDS, you can identify key pieces of information that might matter to you and that aren’t always stated clearly elsewhere: