.svg)

Let's talk spreadsheets and data. If you've been thinking about applying to college for any amount of time, you'll have encountered college rankings sites. And not just your garden variety 'Top 100 Colleges' lists either—they've gotten increasingly niche. The 'Top 25 Hidden Ivies,' 'Top 50 Small Liberal Arts Colleges,' and recently, I even came across 'The 50 Most Underrated Colleges & Universities.'
After reviewing how five major ranking systems weighted their 2025 lists, I noticed a pattern that I found a little alarming: the factors students actually experience daily—class access, research opportunities, teaching quality—barely register in these methodologies. Here's what's really driving these rankings, and why you need a different approach.
US News & World Report is the granddaddy of all the rankings, but hot on their heels are Forbes, The Wall Street Journal and Money. LinkedIn has even entered the fray as of this year. So let's take a look at each of their 'Top 20 Colleges' lists:
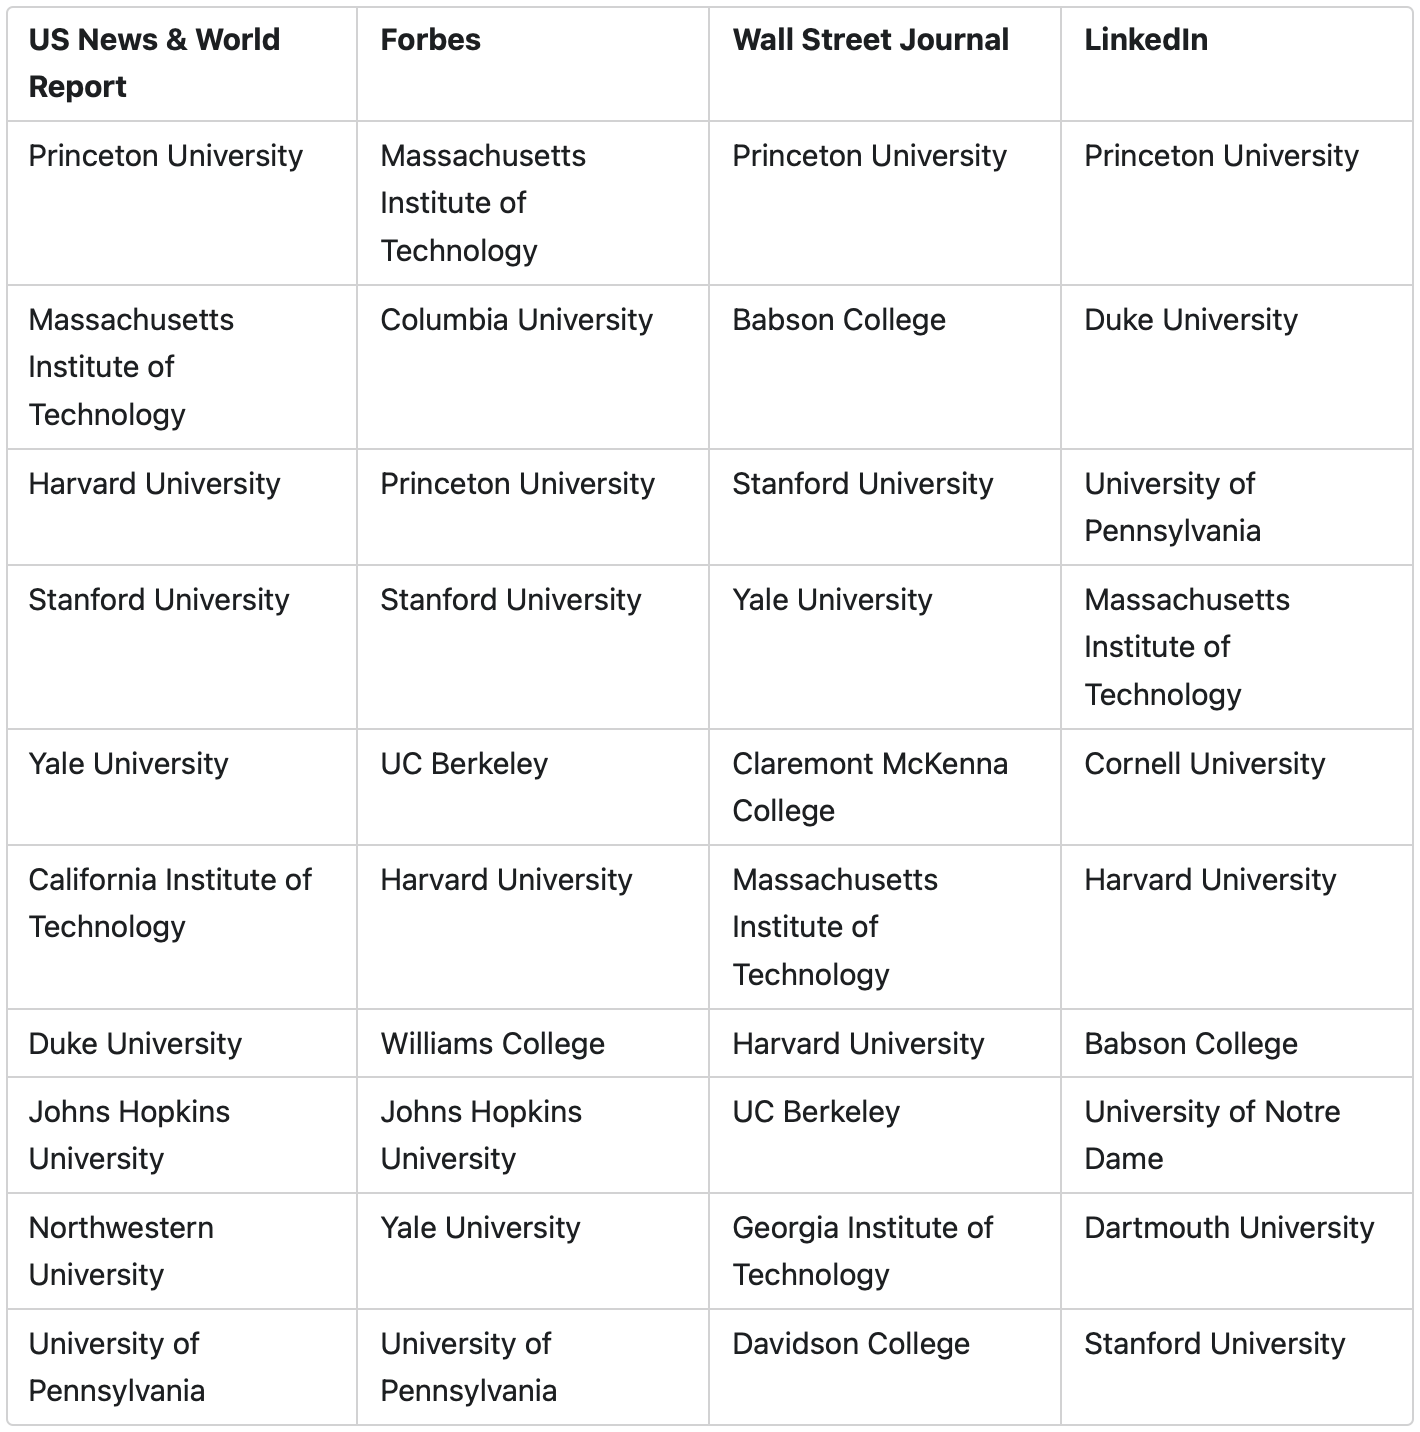
Some of the usual suspects and some surprising entries. But my next question, and the one I want to really spend time on here, is this: What goes into each weighting strategy?
So, what goes into each weighting strategy? Each ranking system reveals its true values through how it prioritizes different factors:
US News recently made a large methodology shift that reveals how arbitrary these weightings really are. To emphasize social mobility, they eliminated five data points entirely:
Money Magazine is, unsurprisingly, laser focused on affordability and outcomes:
30%: Quality of education
40%: Affordability
30% Outcomes
Forbes emphasizes return on investment and career outcomes:
The Wall Street Journal's methodology, at a high level, is:
LinkedIn, a new entry into the rankings game, puts a lot of emphasis on career outcomes:
Here's the pattern I see across all these rankings: factors that my students care about deeply barely show up.
The student experience—things like ability to get the classes you need, access to research opportunities—barely shows up in the weighting strategy. Factors that might influence the academic environment—things like class size and who's teaching your student—aren't given much, if any, weight, depending on the ranking.
Here's what the numbers tell us: The WSJ weights "learning environment" at 20%. US News only weights "classroom factors" at about 6-8%. These rankings measure what's easy to quantify (spending, ratios, outcomes) rather than what students actually experience in classrooms or on campus day-to-day.
Here's what this means for multi-passionate students specifically: This ranking approach is blind to what they need most. When rankings prioritize narrow metrics like starting salaries by major, they can't capture schools that excel at interdisciplinary learning or support students who want to combine fields in innovative ways. A school that's brilliant at helping students design double majors, explore multiple interests, or create independent studies gets no ranking boost for this flexibility.
I'm seeing this pattern play out in real time: As political winds have shifted and society has focused more on access, these rankings have moved away from valuing education-related factors like class size toward social mobility metrics. This is why big state R1 institutions like UCLA and UCSD have climbed the rankings significantly. They're no longer being penalized for large class sizes or graduate students teaching—factors that directly impact the learning experience.
It depends on whether you can find a ranking that weights factors in a way that reflects your family's values. Many things that matter most to my students simply don't show up in these rankings. Of course they care about career outcomes, but not exclusively. Most care deeply about having a rich, engaging academic and social experience.
Here's what I recommend instead: create your own rankings.
Start with clarifying what matters. Think about:
Here's the very simple method that works well: create a spreadsheet with whatever columns matter to you. Add one column for selectivity (Likely, Target, Reach, High Reach). Then add another for 'Overall Fit Assessment’. You can use a 1-5 rating system there. As you add schools to your list, assess each one for fit and give it a fit score. (This is not a perfect science, you're using your judgement as you go.) If you know spreadsheets, go a step further and create a formula to weight each column appropriately.
Once you've completed your research, sort your list by selectivity and then by fit score. Here's what you'll have: a balanced college list with your best fits rising to the top of each selectivity band.
Your priorities will likely shift as you learn more about colleges and your student's interests evolve but this is a start.
Rankings measure what's easy to quantify, not what creates transformative college experiences. For students interested in intentional exploration especially, the most important factors—intellectual flexibility, interdisciplinary opportunities, and supportive exploration—don't appear in any ranking formula.